
What do we mean by “Big Results”?

Big Results are disproportionate outcomes achieved with bounded resources and smart leverage. In plain terms, it’s when a small, well-aimed effort yields an outsized improvement—10x more impact rather than 10% more. The core idea rests on three pillars: leverage (tools, capital, or automation that multiply effort), compounding (feedback loops that accelerate over time), and tight feedback (fast signals so you can correct course early). Unlike vague “success,” Big Results are observable, attributable to a mechanism, and repeatable under similar conditions.
Clear definitions you can reuse
Let’s pin down the vocabulary so we don’t talk past each other. Big Results: a measurable step change in outcomes (revenue, retention, quality), typically ≥ an order of magnitude improvement versus baseline. Leverage: any resource that multiplies output per unit input—code, media, money, or partnerships. Signal-to-noise: how clearly you can detect causal impact amid random variation. Compounding loop: a process where results feed inputs (e.g., more users create more content, which attracts more users). Operationally, Big Results sit at the intersection of high leverage and high signal, with a loop that amplifies gains.
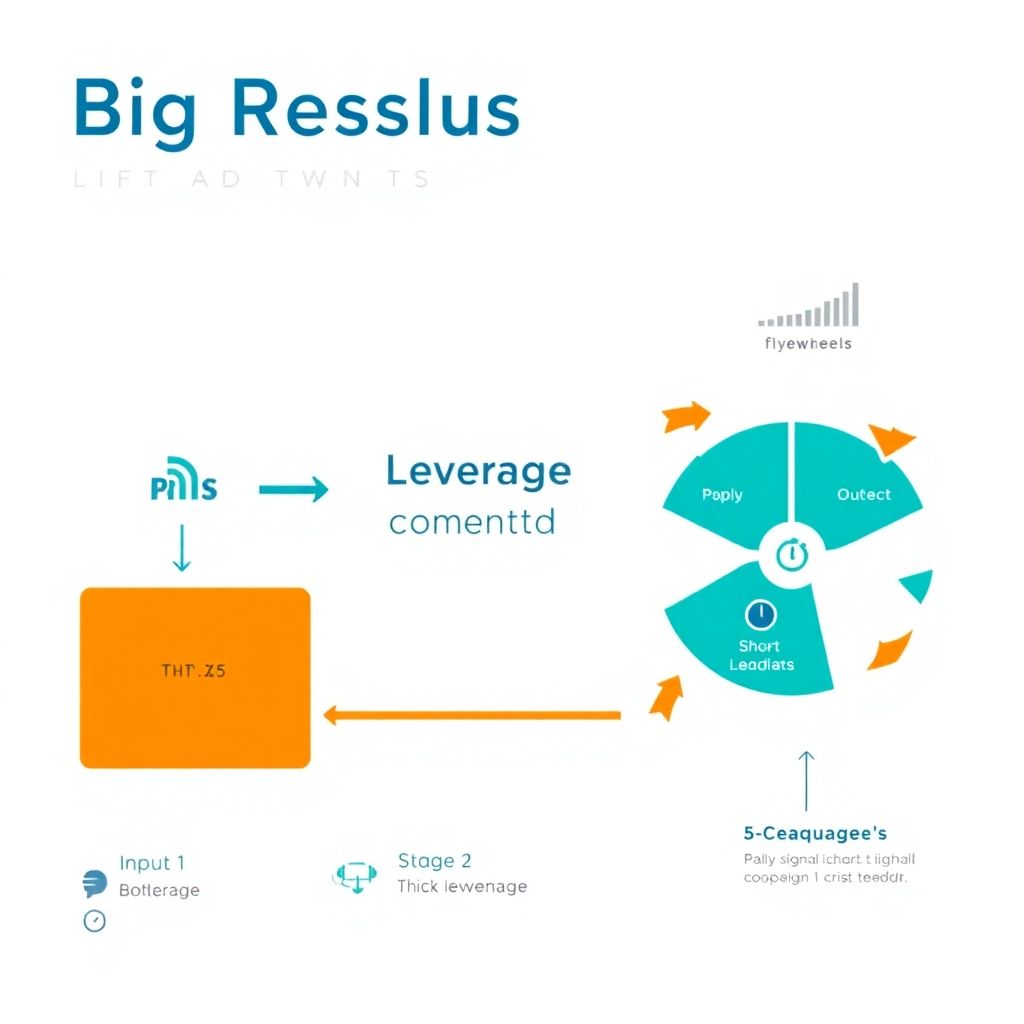
Diagram in text: “Input → Leverage → Outcome → Feedback”
– Imagine a simple flow: [Focused Input] —(Automation/Capital/Brand)—> [Outcome Jump] —(Measurement/Attribution)—> [Refinement]. When the feedback arrow is short (fast), and the leverage box is thick (strong), the system naturally produces Big Results.
How Big Results emerge: a simple model
In practice, Big Results tend to appear when a team identifies a bottleneck that gates many downstream wins and then applies a leverageable intervention. Think of it like removing the narrowest point in a pipeline: throughput jumps everywhere without touching every other part. The trick is to pick interventions where learning is fast and reinvestable. For instance, a digital marketing agency might automate creative iteration to compress testing cycles; each week saved compounds across campaigns, magnifying ROI. The model favors actions that shrink cycle time, reuse assets, and amplify distribution.
A flywheel you can draw on a napkin
Textual diagram:
– Stage 1: Choose a narrow, high-friction problem (◎ Bottleneck).
– Stage 2: Apply leverage (▣ Automation, API, Budget, Brand).
– Stage 3: Measure a crisp metric (◆ KPI with daily signal).
– Stage 4: Reinvest gains (⬈ More budget, features, or reach).
– Loop back to Stage 1 with better data and capacity.
If the arrows accelerate (shorter time per loop) and the nodes gain weight (more capacity each cycle), you’re on track for non-linear outcomes.
Comparison with analogs: quick wins, incrementalism, blitzscaling
Quick wins feel satisfying but usually lack compounding; they’re like snacks, not nutrition. Incrementalism—steady 1–3% improvements—keeps systems healthy but rarely breaks plateaus. Blitzscaling, at the other extreme, buys growth with high burn and risk, sometimes outrunning product-market fit. Big Results sit in a pragmatic middle: targeted, evidence-driven moves that unlock step changes and then compound. Compared with incrementalism, it insists on leverage and fast feedback; compared with blitzscaling, it demands validated learning and unit-economics discipline before doubling down.
Metrics and diagnostics that keep you honest
You can’t manage what you don’t measure—especially when chasing step changes. Start with a baseline: know your current throughput, cost, and quality distributions. Then define a “step-change bar” beforehand (for example, 5–10x lift in a submetric or a 50% cost reduction at constant quality). Crucially, instrument leading indicators so you don’t wait months for lagging revenue. In marketing, leading indicators might be qualified traffic quality or demo request velocity; in product, activation events per cohort. Tie Big Results to guardrails: margin, reliability, and risk exposure must remain acceptable.
Leading vs. lagging indicators
Lagging metrics (profit, LTV, churn) confirm victory but react slowly. Leading indicators are the early tremors you can act on: cost-per-acquisition at equal quality, time-to-first-value, or deploy frequency with incident rate. The governance insight is to define an explicit causal chain—“If this leading metric moves by X within Y days, we’re confident the lagging metric will follow.” Then implement post-hoc validation to avoid fooling yourself with vanity signals.
– Useful leading indicators:
– Time-to-signal: hours or days until you can detect a reliable change.
– Efficiency ratios: output per engineer-hour or per $1,000 ad spend.
– Quality-adjusted volume: e.g., SQLs that pass sales qualification, not just raw MQLs.
– Guardrails to prevent false wins:
– Error budgets and customer satisfaction thresholds.
– Unit economics (gross margin after media and operations).
– Risk exposure caps (credit, compliance, brand).
Practical playbook to engineer Big Results

Begin by mapping the system as a few controllable levers and unavoidable constraints. Select a lever with two properties: it influences many downstream metrics and it’s amenable to automation or capital scaling. Then design a minimum viable experiment that can run to statistical signal quickly—days, not quarters. For example, a performance marketing agency might unify creative generation and audience testing, using scripts to launch and kill variants hourly. Meanwhile a growth marketing agency could focus on activation, redesigning onboarding so time-to-first-value shrinks from days to minutes, which has a compounding effect on retention and referrals.
– A sequence that works in the field:
– Identify a chokepoint via funnel analysis; quantify its total opportunity.
– Brainstorm interventions that add leverage (APIs, models, partnerships).
– Build a thin experiment with clear pass/fail criteria and a timeboxed window.
– If it passes, reinvest: scale spend, productize the workflow, and harden quality.
– Where to apply the model in go-to-market:
– SEO services: target high-intent clusters, build programmatic pages with strict quality checks, and use internal linking to compound authority.
– Lead generation services: compress qualification steps with enrichment and scoring, then route instantly; measure sales-accepted lead rate within 48 hours.
– Brand and PR: systematize story mining and distribution until earned media flywheels sustain reach at lower marginal cost.
Case snapshots: translating theory to action
A B2B team discovered that demo-to-close lag, not top-of-funnel volume, was the bottleneck. They introduced automated calendaring, pre-demo microvideos, and instant enrichment; qualified buyers arrived prepared, and close rates doubled while cycle time halved. The gains compounded as reps handled more opportunities per week. In another case, a digital marketing agency built a content ops pipeline that generated modular articles tied to intent themes; with careful interlinking and technical hygiene, organic sessions rose 8x over two quarters without sacrificing conversion quality—an example of leverage plus compounding rather than brute-force spend.
Expert recommendations you can apply today
Seasoned operators converge on a few rules of thumb. First, design for time-to-learning, not time-to-launch; speed to the first trustworthy signal predicts eventual scale. Second, insist on leverage in the solution—automation, reusable assets, or distribution partnerships—so wins don’t depend on heroics. Third, encode feedback loops as part of the system: alerts, dashboards, and weekly reviews that trigger automatic actions when thresholds hit. As one veteran CMO puts it, “If your experiment can’t be rerun and amplified with twice the budget tomorrow, it was a stunt, not a system.”
– Practitioner tips from the field:
– Predeclare what success looks like and who can greenlight the next spend tier.
– Separate exploration (wide, cheap tests) from exploitation (narrow, scaled bets).
– Keep a living map of constraints; when one moves, re-rank your backlog.
Diagram in text: “Decision Tree for Scale-Up”
– Node A: Did the test hit the leading indicator threshold within the timebox? If no, archive learning and move on. If yes, check guardrails.
– Node B: Are guardrails intact (quality, margin, risk)? If no, iterate containment. If yes, double budget and lock in automation before hiring.
In short, Big Results don’t require magic. They come from precise definitions, leverage-rich interventions, and loops that learn faster than the market changes. Whether you’re inside a startup, a product org, or advising as an agency, the same principles apply: find the chokepoint, design for compounding, and let measurement guide the scale.