

Why financial statements matter when you actually need decisions

If you’ve ever stared at a P&L and wondered, “So… should we hire or wait?”, this guide is for you. Financial statements aren’t museum pieces; they’re decision dashboards. The income statement shows pace, the cash flow statement shows stamina, and the balance sheet shows posture—together they tell you whether the business can sprint, recover, or needs a breather. A practical lens means tying each line item to an action: prices you can raise, costs you can renegotiate, assets you can sweat harder, and risks you can ring‑fence. Instead of chasing “perfect” numbers, aim for consistent signals over time. Even a simple monthly trend can flag when margins thin, when receivables stretch, or when inventory quietly eats your lunch. That’s the heartbeat of financial statement analysis: reading patterns, not just points.
How to read financial statements without drowning
Let’s demystify how to read financial statements in a way that sticks. Start with a guiding question, not with the numbers. For example, “Can we fund growth internally next quarter?” Then scan gross margin, operating cash flow, and working capital days. If the story conflicts—say profit up but cash down—trace the bridge: accruals, prepaids, deferred revenue, or inventory build. On the income statement, isolate unit economics: revenue per unit, variable cost per unit, contribution margin. On the balance sheet, hunt for “slow” items: aging receivables, idle assets, or bloated safety stock. Finally, on cash flow, separate recurring cash from timing noise. You’ll move faster by tagging each figure as control, influence, or monitor. Control what you can change this month, influence what you can change this quarter, and monitor what only time corrects.
Real cases: when the numbers changed the plan
Case 1: A DTC skincare brand showed rising sales but flat cash. The culprit wasn’t ads—it was free shipping thresholds inflating fulfillment costs and returns. By slicing gross margin net of logistics, they discovered true contribution was negative on small baskets. Fix: lift the free‑ship threshold and shrink box sizes. Cash turned positive in two cycles. Case 2: A SaaS startup celebrated a big enterprise deal, yet churn ticked up. Deferred revenue made the income statement look healthy, but cash flow from operations sagged due to longer implementation. They began recognizing “implementation debt” in ops metrics, not GAAP, and gated sales promises until onboarding capacity caught up. Case 3: A regional retailer blamed “seasonality” for weak quarters. A cohort view by store opening date revealed new stores cannibalized older ones within a three‑mile radius. Shifting assortments by micro‑market and tightening reorder points improved inventory turns by 1.2x without new capital.
Non‑obvious solutions to common reporting traps
If margins look stable but profits still slide, test for hidden denominator drift: marketing reported as CAC without returns and replacements, or customer support excluded from cost of sales. Pull a shadow P&L where you reclassify gray‑area costs to reflect how revenue actually happens. Another trick: convert everything important into per‑unit and per‑hour terms. When a service firm mapped costs per billable hour including bench time, pricing gaps jumped off the page. Also, swap the classic “monthly close” mindset for “weekly flash”—a lightweight view of sales, cash, and pipeline that catches trends early. And don’t forget sensitivity analysis: nudge three assumptions—price, volume, and collection days—by 5% each. You’ll learn more from that tiny stress test than from a glossy deck of averages.
Alternative methods beyond ratios and checklists
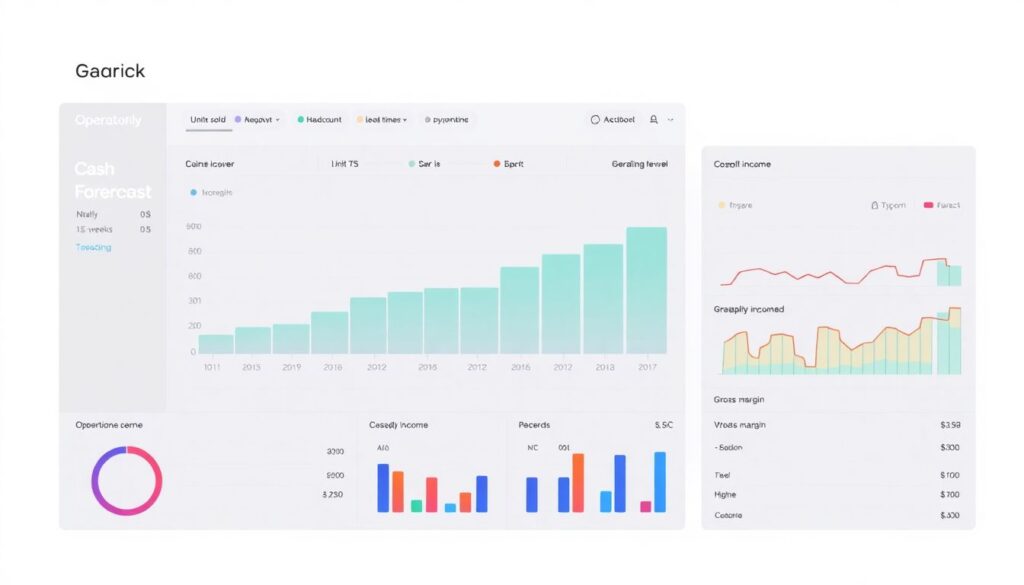
Traditional ratios are useful, but adding operator‑friendly views changes the game. Try a rolling 13‑week cash forecast tied to operational drivers: units sold, headcount, lead times, and payment terms. It keeps you honest about near‑term liquidity. Build cohort income statements that track gross margin and support load by customer vintage; this exposes whether “growth” is only fresh acquisition masking weak retention. Use contribution margin by channel to decide which campaigns deserve inventory priority when supply is tight. Scenario trees beat single forecasts: outline Base, Push, and Protect cases, each with trigger metrics (e.g., if receivables > 55 days, freeze noncritical capex). Finally, triangulate: reconcile operational KPIs with financials—if website conversion jumps but revenue doesn’t, either average order value fell or refunds rose. The triangle keeps narrative drift in check.
Tools and workflows that keep you moving
You don’t need a finance degree to start; a clean workflow beats a complex model. Begin with a financial statement template excel you trust, then lock the structure and only tweak inputs. Add a “notes” column where you write the story behind variances in plain English—future you will thank present you. When you grow, graduate to financial analysis software that connects to your accounting system and CRM; the key is to map your chart of accounts to operational drivers, not just import data. If you prefer guided learning, a short financial statement analysis course can sharpen instincts, especially around cash vs. profit timing. Build a monthly ritual: close light, review three leading signals (pipeline quality, collection days, unit margin), and run one scenario before approving spend. Keep dashboards dull but consistent; novelty belongs in experiments, not in your core reports.
Pro‑level habits that compound over time
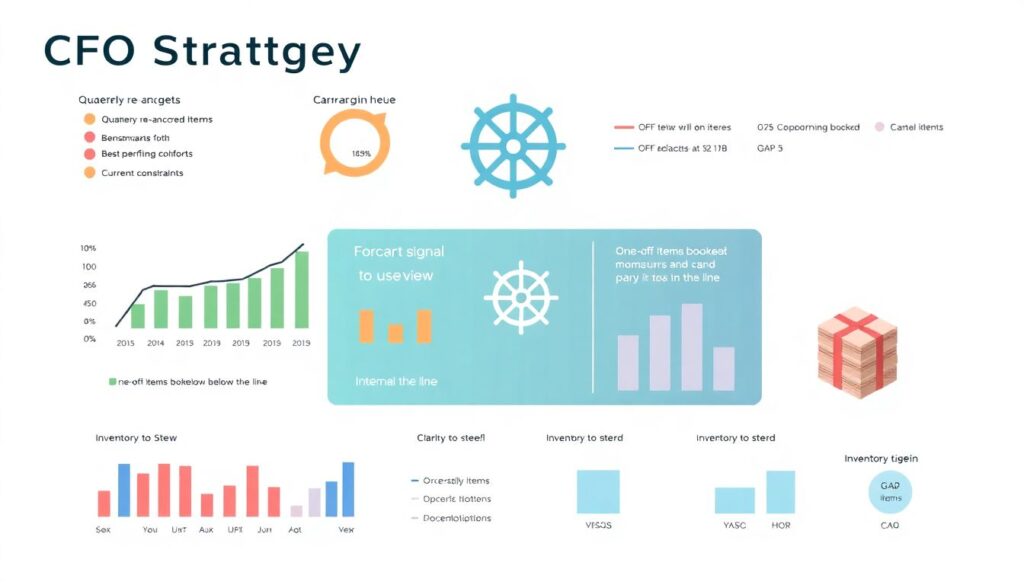
– Re‑anchor targets quarterly. Instead of fixating on last year, benchmark against your own best cohorts and your current constraints.
– Separate noise from signal: book one‑off items below the line in your internal view, even if GAAP parks them elsewhere. You need clarity to steer.
– Tie inventory to a living forecast, not a gut feel. Use min‑max rules that update with lead time volatility and sell‑through, then audit slow movers weekly.
– Maintain a “stop list” of expenses that auto‑expire unless re‑justified; it’s the simplest guardrail against cost creep.
– Create a post‑mortem for forecasts: what did we assume, what broke, what will we measure next time? That discipline sharpens every future financial statement analysis.
In short, keep the questions practical, the models simple, and the feedback loops tight. The numbers don’t make decisions—you do—but when read well, they point the way.