
Why a Personal Finance Dashboard Beats “Winging It”
If your money feels like it’s all over the place — a few subscriptions here, random card payments there, some savings “somewhere” — you’re exactly the person who benefits most from a simple personal finance dashboard. Over the last three years, the need for clarity has only grown: according to a 2023 survey from the Federal Reserve, about 37% of U.S. adults said they couldn’t cover a $400 emergency with cash or savings, which is only a slight improvement from 2022 and still worse than pre‑2020 levels. At the same time, separate industry research in 2022–2024 consistently shows that people who use some kind of budgeting system — even a basic spreadsheet — are more likely to have an emergency fund and less likely to carry high‑interest credit card debt. In other words, you don’t need to be a finance nerd; you just need a single, clear view of what’s coming in, what’s going out, and what’s left over, and that’s exactly what a dashboard gives you.
Step 1: Decide What You Want Your Dashboard to Do
Before you touch a spreadsheet or download any personal finance app for budgeting and expense tracking, pause and decide what “control” actually means for you. A dashboard is not a magic button; it’s a tool that should answer a small set of very specific questions every time you open it. Over the last three years, as inflation and interest rates moved up and down, people who adjusted their budget regularly were better able to keep saving rates steady, according to multiple 2022–2024 consumer finance studies. Your goal is to be one of those people: someone who can quickly see, on one screen, whether you’re on track this month, what bills are coming, and how much can realistically go to savings or debt.
Core questions your dashboard should answer
Think about the money questions that stress you out most. Your dashboard should be designed around making those questions easy to answer in seconds, without digging through statements or logging into five different bank apps just to get the big picture. If you can’t describe what success looks like, you’ll probably build something that looks fancy but doesn’t actually help your day‑to‑day decisions or reduce your anxiety about money.
– How much do I really spend in a typical month, and on what?
– What bills are coming up in the next 30 days, and are they covered?
– How much can I safely save or invest without worrying I’ll be short?
– Am I getting closer to my goals (debt‑free, house down payment, bigger emergency fund) or slipping backwards?
Common mistake at this stage
A frequent beginner error is trying to copy a complex template from the internet without understanding what each part is for. Over the last three years, as best budgeting apps for personal finance tracking became more popular, user studies showed that people often quit within a month because they felt overwhelmed by too many charts, categories and features. Don’t build a “finance cockpit” for a jumbo jet if you’re just trying to land a small plane; start with the few metrics you truly care about and add more only when you feel a genuine need.
Step 2: Choose Your Stack — App, Spreadsheet, or Both
Next, you’ll pick where your dashboard will live: on your phone, in a spreadsheet, or in a mix of both. There’s no universally perfect choice, despite what shiny ads for personal finance dashboard software might suggest. The right setup for you depends on how much you like to tinker, how comfortable you are with numbers, and how much time you’re realistically going to spend updating things. From 2022 to 2024, surveys from firms like Bankrate and NerdWallet showed a steady rise in people using digital tools for money management, but also a surprising persistence of simple spreadsheets as the “backup brain” behind many households’ budgets.
Option A: Apps that automate as much as possible
If you hate data entry, the best budgeting apps for personal finance tracking will likely be your starting point. Most modern apps connect to your bank and card accounts, pull in your transactions, and automatically label them. Over the past three years, adoption of these apps has grown, especially among younger users, driven partly by the rise of “open banking” APIs that make secure data sharing easier. The trade‑off is that you get less control over how things are calculated, and you may end up paying a subscription fee. But if you’re the kind of person who lives on your phone and likes push notifications, an app can be the engine that feeds your dashboard with up‑to‑date numbers.
Option B: Spreadsheets for full control
If you like flexibility and transparency, or you just enjoy tweaking formulas, then learning how to create a personal finance spreadsheet in Excel (or Google Sheets) is worth your time. A spreadsheet gives you full visibility into every calculation, which is especially useful if you’re suspicious of “black box” categories some apps use. Over the last three years, online course platforms have reported consistent demand for beginner Excel budgeting tutorials, which suggests many people are still more comfortable with a simple sheet than with another app that wants login access to their bank. The downside is manual maintenance: you’ll either key in expenses or paste data regularly to keep things current.
Option C: Combine the two
A practical middle ground is to let an app handle the grunt work of importing and categorizing transactions, then export the data into a custom spreadsheet that acts as your real dashboard. This hybrid approach is popular among people who start with personal finance tracking tools for beginners and, as they get more confident, want more tailored reports. For example, you might use an app’s export function once a month, paste the data into Excel, and let your own formulas calculate savings rates, debt payoff speed, and progress toward specific goals. This way, you get automation without losing the clarity that comes from seeing exactly how the math works.
Beginner tip
If you’re completely new, pick one primary tool and stick with it for at least 60–90 days. Switching apps or templates every week is a subtle form of procrastination that keeps you busy without actually improving your finances. Consistent, even if imperfect, data beats a “perfect system” you don’t use.
Step 3: Collect the Numbers You Need (and Ignore the Rest)
Now it’s time to gather data, but keep this step deliberately simple. You don’t need five years of history to start; the past 60–90 days usually gives you a realistic picture of your current lifestyle. Since 2022, as inflation pushed up everyday costs, studies from organizations like the U.S. Bureau of Labor Statistics showed noticeable jumps in spending on groceries, rent and utilities — categories most people underestimate. Looking at the last few months of your own transactions lets you see how inflation has affected you personally, rather than relying on headlines, and builds a baseline for your dashboard.
Essential inputs for your dashboard
Focus on a few key data types. Too much detail at this stage makes the process so annoying that people give up, which is one reason so many personal finance tracking tools for beginners now emphasize “start simple” modes. Your goal is just to see the main flows of money in and out, not to perfectly categorize every coffee you’ve bought in the last year.
– Income: salary, freelance payments, benefits, regular transfers in
– Fixed expenses: rent/mortgage, utilities, insurance, loans, subscriptions
– Variable spending: groceries, restaurants, transport, shopping, hobbies
– Savings and debt: contributions to savings/investments; payments to credit cards, loans
Where to pull the data from
You can pull your numbers from bank and card statements, exported CSV files from your banking apps, or directly from a budgeting app if you use one. Many banks now let you download the last 90 days of transactions with a couple of clicks, which you can then import into Excel or Google Sheets. If that sounds intimidating, start even smaller: write down the last month’s pay, your main bills with amounts, and estimate typical spending by scanning through your card history. The point is not perfect accuracy on day one; it’s to get something close enough that your dashboard paints a realistic picture.
Big mistake to avoid
Don’t get paralyzed by missing data. People often say, “I’ll start once I’ve categorized everything from last year,” and then never start. Over the 2022–2024 period, behavioral finance research consistently showed that delay and perfectionism are bigger threats to financial progress than minor errors in tracking. It is far better to be approximately right with the last 2–3 months than precisely wrong with a system that never leaves the planning stage.
Step 4: Design the Structure of Your Dashboard
With some data in hand, you can sketch the structure of your personal finance dashboard before you build it. Think of this as deciding what “widgets” or panels you want on your main screen. You want to be able to open it, glance for 30 seconds, and know whether you’re okay or need to adjust. Over the past three years, user testing on personal finance dashboard software has shown that people stick with tools that show a small number of clear, high‑impact metrics, rather than overwhelming them with dozens of tiny charts.
The four core panels of a simple dashboard
A clear, beginner‑friendly layout usually has four main sections. You can expand later, but starting with these keeps things manageable. Remember: your dashboard isn’t a database; it’s a summary. The underlying data can be messy; the top layer should feel calm and obvious.
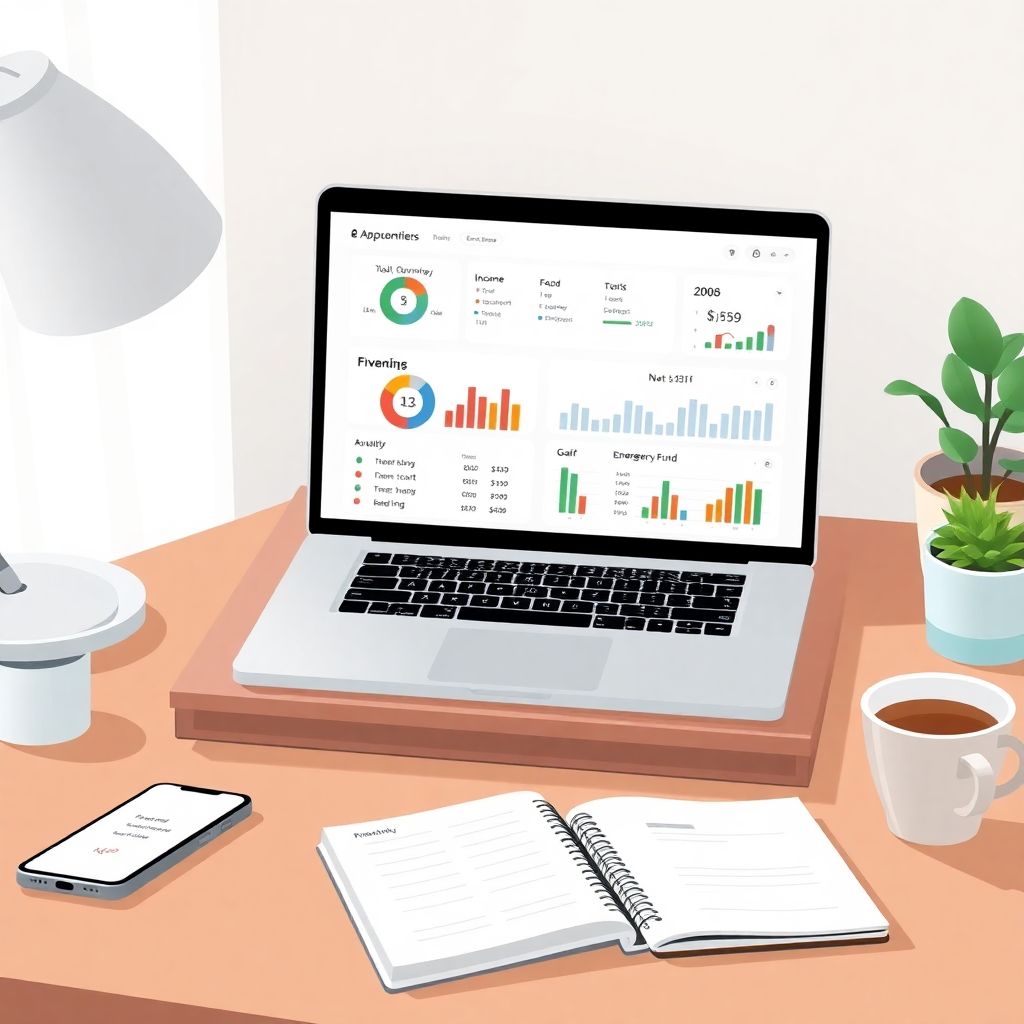
– Overview: income, total spending, and savings for the current month
– Spending breakdown: major categories like housing, food, transport, debt
– Cash position: how much is in your main accounts and how much is already “spoken for”
– Goals: progress bars for specific targets like “3‑month emergency fund” or “pay off Card A”
Visuals that actually help (and ones that don’t)
Visuals should make decisions easier, not just look impressive. A simple bar or pie chart showing category spending for the month can quickly reveal that restaurants are eating 30% of your take‑home pay. A line chart tracking your total savings balance since 2022 can show whether you’re staying ahead of rising costs or gradually sliding backward. What you don’t need are ten tiny charts that you never look at. If a visual doesn’t make you think “I should change X” or “I’m glad Y is working,” it probably doesn’t belong on your main dashboard.
Warning: avoid over‑customization early on
The trap many detail‑oriented people fall into is building an elaborate system of micro‑categories and color codes before they’ve spent even one month using the dashboard. This feels productive, but it rarely changes behavior. Start with broad categories — housing, food, transport, debt, fun — and only split them out if you keep asking, “I wish I knew more detail about this one area.” That way, the structure grows out of genuine questions, not from a desire to make the sheet look “professional.”
Step 5: Build It in Excel or Google Sheets (Hands‑On)
Let’s walk through a basic build, assuming you’re using a spreadsheet. You can adapt the same logic if an app lets you create custom views or reports. The aim is to keep the formulas simple and transparent, so you always understand where the numbers on your dashboard are coming from. Clarity is the whole point; if the dashboard ever feels like a black box, you’re less likely to trust it and use it to make real decisions.
Lay out your raw data
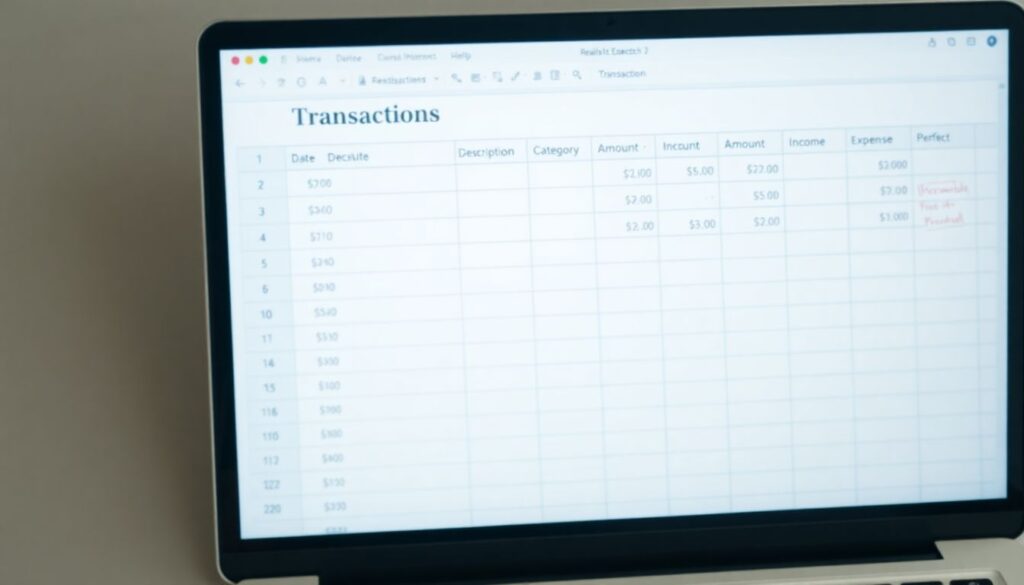
Create a tab called something like “Transactions.” In it, have columns for date, description, category, amount, and type (income or expense). If you imported from your bank or an app, clean up the categories a little so they match the ones you picked earlier. Don’t obsess over tiny corrections; you can refine as you go. The key is to have one place where all your inflows and outflows live, so the rest of your dashboard can just read from this table.
Create a summary tab — your actual dashboard
Now add a new tab called “Dashboard.” This is the page you’ll open most often. At the top, reserve a space for “This Month at a Glance”: total income, total expenses, and the difference (which should be positive if you’re living within your means). Below that, add sections for your spending breakdown and goal progress. Use simple SUMIF or similar functions to total amounts by category and by month. As you get more comfortable, you can add small charts to visualize category spending and savings growth over time.
Beginner‑friendly tools to make this easier
If formulas scare you, you’re not alone. Many personal finance tracking tools for beginners now offer CSV exports that are already categorized, so you just need to sum them up. You can also find step‑by‑step tutorials that show exactly how to create a personal finance spreadsheet in Excel with prebuilt formulas you can adapt. The main thing is not to let technical hesitations stop you. Start with the simplest possible calculations — even manual totals at first — and upgrade to formulas when you’re ready. Remember, your goal is insight, not spreadsheet perfection.
Common error to watch for
Double‑counting is a sneaky issue. For example, if you move money from your checking to savings, that should not show up as “spending,” but many exported transaction lists will label it that way. Make sure internal transfers are either excluded from your expense totals or classified into a special “transfer” category that your dashboard formulas skip. Otherwise, your spending will look higher than it really is, which can push you toward unnecessary cuts.
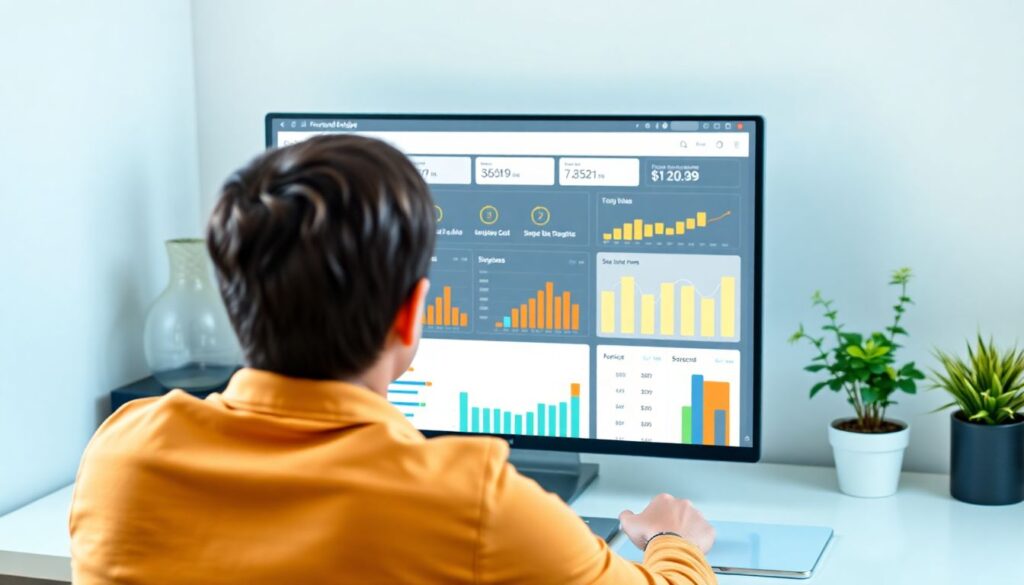
Step 6: Connect Your Dashboard to Real‑World Decisions
A dashboard is only useful if it changes what you do in the real world. Over 2022–2024, multiple personal finance surveys found the same pattern: people who checked their budget or money app at least weekly were more likely to adjust spending quickly when prices or income changed, and less likely to carry a balance on high‑interest cards. The key difference wasn’t the tool itself; it was the habit of looking and then acting. Your dashboard should naturally lead you to small, repeatable decisions that move you closer to stability and your goals.
Build weekly and monthly rituals
Instead of treating money as something you face only when there’s a crisis, create short, predictable check‑ins tied to your dashboard. These don’t need to be long or dramatic; in fact, the shorter and calmer they are, the more likely you’ll stick with them over the long term, even when life gets busy or stressful.
– Weekly (10–15 minutes): update transactions, glance at category spending, and decide if any adjustments are needed before next payday.
– Monthly (20–30 minutes): review the whole month, check progress on savings and debt goals, and tweak next month’s plan if the last one was unrealistic.
Translate what you see into actions
If your dashboard shows that you’ve spent 80% of your restaurant budget by mid‑month, that can trigger an easy decision: cook at home more for the rest of the month. If the “cash position” panel shows that most of your balance is already reserved for bills, you might postpone a non‑urgent purchase. Conversely, if you see that you’re consistently under‑spending in one category, you could redirect that leftover to accelerate debt repayment or boost your emergency fund. These small, frequent adjustments compound over time — and that compounding effect is why dashboards are powerful, especially amid the economic ups and downs we’ve seen between 2022 and 2024.
Warning: don’t weaponize the numbers against yourself
A big psychological mistake is using the dashboard as a tool for self‑criticism instead of learning. If every review session turns into a guilt trip about past choices, you’ll naturally avoid opening the file or app. Treat the numbers like a car dashboard: if the fuel light comes on, you don’t say, “I’m a terrible driver”; you just get more fuel. The same goes for overspending: notice, learn, and adjust. The point is improved behavior from today forward, not beating yourself up about last month.
Step 7: Add Extra Features Only When You’re Ready
Once you’ve used a simple dashboard for two or three months, you’ll start to notice questions your current setup doesn’t answer well. That’s your signal to add features. By this point, you’ll also be more comfortable with your tools, whether that’s Excel, Google Sheets, or a personal finance app for budgeting and expense tracking that supports custom reports. Expanding from a position of experience is much more effective than trying to predict everything you’ll ever need on day one, which rarely works in practice.
Useful upgrades after a few months
As your confidence grows, you can enhance your dashboard with more nuanced views. Keep asking, “Will this help me make a better decision?” If the answer is yes, it probably belongs. If it just sounds cool, consider postponing it.
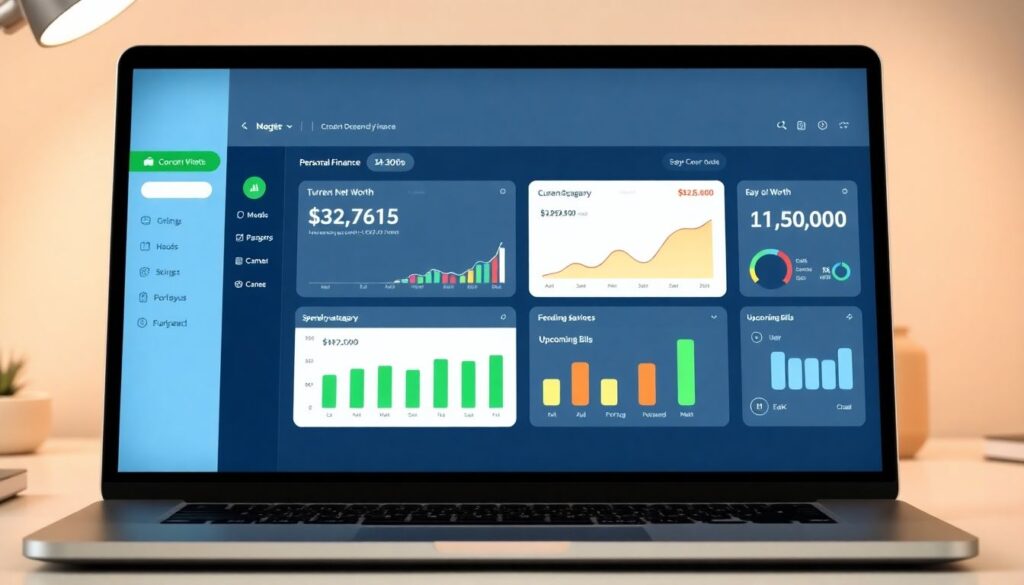
– Net worth tracker: assets (cash, investments) minus debts (loans, cards), updated monthly.
– Debt payoff timeline: estimate how long it will take to clear each debt at your current payment rate.
– Scenario planning: “What if I increase savings by 5%?” or “What if I pay an extra $100 on this card?”
Pulling in more accurate data over time
As you get used to tracking, you might start importing investment account balances, retirement funds, or even property values to build a more complete picture of your net worth. Over 2022–2024, interest in net worth tracking grew significantly as more people realized that focusing only on monthly cash flow hides long‑term progress. Your dashboard can mirror that shift: start with day‑to‑day survival, then gradually add long‑term metrics as your situation stabilizes.
Don’t chase perfection — aim for reliability
No dashboard will ever be perfect, because life isn’t. Income changes, one‑off expenses pop up, markets move. The goal is not a flawless model of your finances; it’s a reliable, roughly accurate view that you can trust enough to guide decisions. If you find yourself constantly redesigning your layout instead of looking at trends and making changes, step back and remind yourself: the value is in using the dashboard, not in endlessly polishing it.
Red Flags, Pitfalls, and How to Avoid Them
Along the way, there are a few predictable traps that can derail even motivated beginners. The good news is that most are easy to sidestep once you know what to look for. Over the last three years, user behavior data from budgeting tools has highlighted the same patterns repeatedly: ambitious starts, complex setups, and quick abandonment when life gets busy or the system feels too demanding to maintain.
Three big pitfalls to watch out for
If you recognize yourself in any of these, don’t panic — just adjust your approach. The earlier you catch them, the easier they are to fix. Most people don’t fail at money management because they’re “bad with numbers”; they fail because their system quietly becomes too annoying to use.
– Over‑categorizing: 40+ categories mean more confusion and less insight; stick to 8–15 broad ones.
– Irregular updates: waiting months to update makes the dashboard feel irrelevant and overwhelming.
– Ignoring reality: if your plan doesn’t match your actual behavior, the problem is the plan, not you.
Security and privacy concerns
If you’re hesitant about linking all your accounts to a cloud app, that’s reasonable. Use providers with strong security reputations, enable two‑factor authentication, and consider limiting access to only your main spending accounts. If you’re still uncomfortable, rely more on spreadsheets and manual imports. Over the 2022–2024 period, there were ongoing debates about data privacy in fintech, but major incidents for consumer budgeting tools remained relatively rare compared to the volume of data they handle. Still, you should only use tools you genuinely trust; worrying about security every time you open the app defeats the purpose of finding clarity and control.
When to simplify instead of upgrade
If you ever feel dread at the thought of opening your dashboard, that’s a sign it might be too complex for your current energy level or life situation. It’s completely fine — smart, even — to strip it back. Remove charts you never look at, merge categories, or switch from daily to weekly tracking. The environment has been financially stressful for many households from 2022 to 2024, with higher living costs and rate changes; your system should support you, not add another layer of pressure.
Bringing It All Together
A personal finance dashboard is not about turning your life into a spreadsheet; it’s about having one simple, honest place where your money story is visible. Over the last three years, with inflation spikes, changing interest rates, and plenty of economic noise, the people who’ve done relatively better are not necessarily the highest earners, but those who pay regular attention, adjust quickly, and make small, consistent moves in the right direction. A basic dashboard — whether powered by personal finance dashboard software, a home‑grown Excel file, or a mix of both — gives you the clarity to do exactly that.
If you’re starting from zero, the best next step is small and concrete: pick one tool, pull the last 60–90 days of data, and sketch a starter dashboard with a handful of categories and a simple monthly overview. Use it for one full month before you even think about fancy upgrades. As you get more comfortable, you’ll naturally refine it into something that fits your life. The goal isn’t to build a perfect system; it’s to build a living, evolving dashboard that quietly keeps you on track, even when the world outside is anything but calm.